Same Difference?
Before we get to it, here is a tip to get the most learning for your time… Use the list of learning objectives below to help you to identify (1) the key concepts of this lesson and (2) what you should be able to do once you master them.
By the end of this lesson, you should be able to:
- Distinguish between what causes a change in quantity demanded and what causes a change in Demand.
- Distinguish between what causes a movement along the Demand curve and what causes a shift of the Demand curve.
- Graph a movement along the Demand curve.
- Graph a shift of the Demand curve.

According to the Centers for Disease Control and Prevention, also known as CDC, cigarette smoking is the leading preventative cause of death in the United States. The good news is that, over the past few decades, consumers have been smoking less and less.
There are two main contributors for this change: higher prices and tastes.
Over the last decades, cigarette prices have increased tremendously, partly because of higher taxes, which some say are the best way to curb smoking. Higher taxes find their way into higher prices, and those make consumers less willing and able to pay for cigarettes, thus lowering smoking.
Public knowledge and opinion changed too. On April 1, 1970, the Public Health Cigarette Smoking Act banned cigarette ads from airing on television and radio. This being said, in 2007, Big Tobacco was forced to run a different kind of add, warning consumers about the devastating health effects of smoking on the body. Almost twenty years earlier, in 1986, the Federal Trade Commission had required cigarette packages to carry warning labels. The list of laws and regulations could continue but you get the point: smoking is not as appealing.
So we have a combination of factors driving the decrease in smoking:
Higher Prices
+
Smoking is Bad
=
Less Smoking
Although the bottom line is the same, and that is that people are smoking less, and thus are buying fewer cigarettes or cigarette packages, the drivers of this change are different. For economists, this matters a lot. Despite sounding similar, the drivers of changes in quantity demanded differ from the drivers of changes in Demand, and they warrant different analyses as well. We look at these next.
Change in Quantity Demanded
Changes in Quantity Demanded are driven by changes in the price of the good. The idea is that consumers respond to an increase in price by buying less of the good, and that consumers respond to a decrease in price by buying more of it. This is just the Law of Demand at work.
Indeed, economists like to go a step further and add the Latin expression ceteris paribus, and that just means that all other variables that could potentially affect buyers willingness and ability to buy the good are kept constant, or unchanged. In our story, this means that looking at the effect of changes in the price of cigarettes and assuming that tastes or preferences did not change (we know that this is not what actually happened but assuming these additional changes away helps to focus our attention).
At this point, I want to talk to you about Eric Lawson, an actor who played the “Marlboro Man” in a series of cigarette ads for Phillip Morris (see an example below). He went from helping to sell cigarettes to helping raise awareness of the hazardous health effects of smoking, even appearing in an anti-smoking campaign for the American Cancer Society. He died of lung cancer in 2014.

Let’s focus our attention to Eric’s willingness and ability to buy cigarettes during his early career, before he learned that smoking was bad.
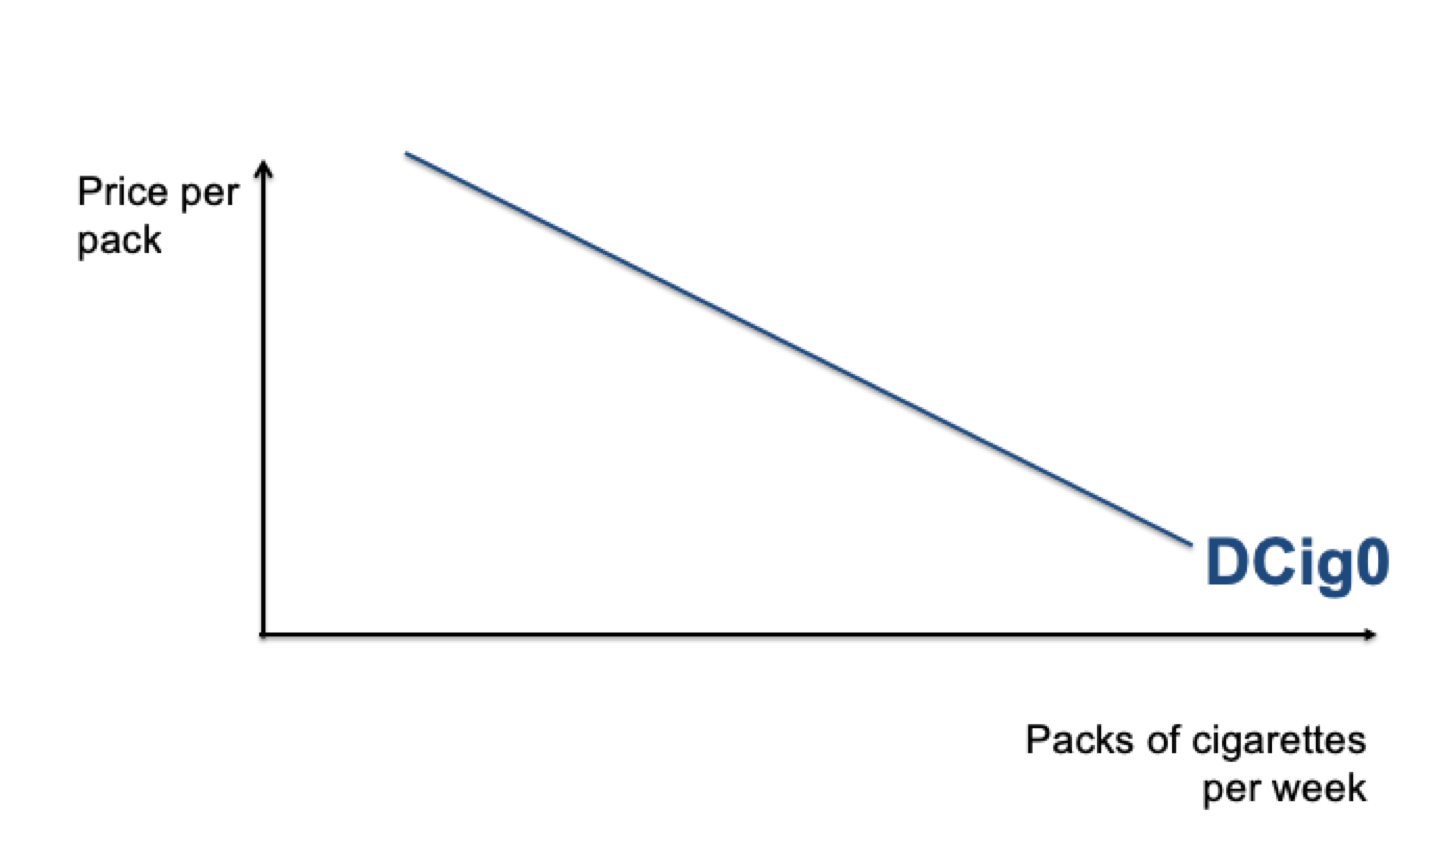
Suppose Eric’s Demand for cigarettes was represented by the Demand curve DCig0 in the figure below:
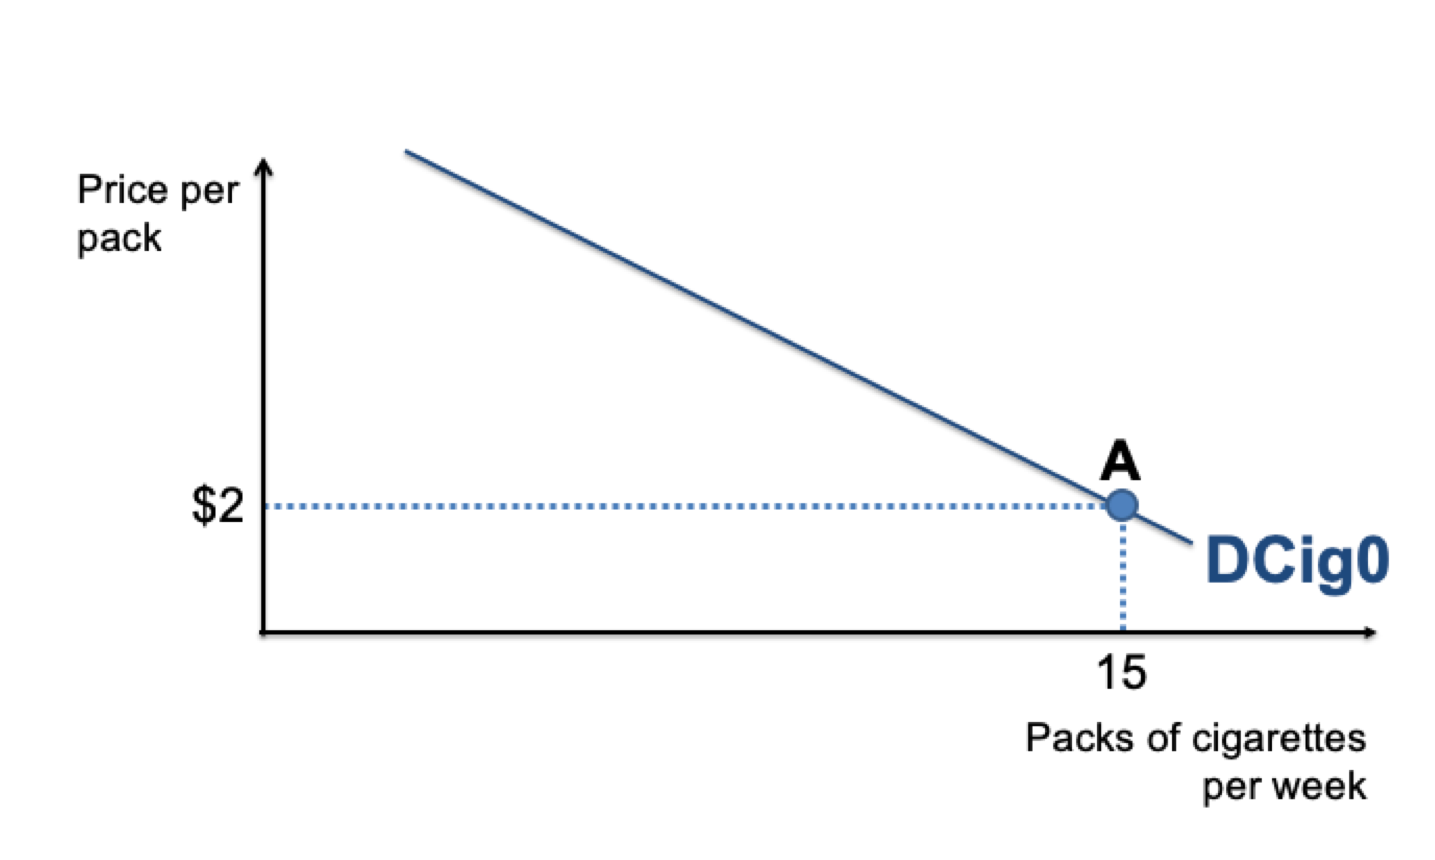
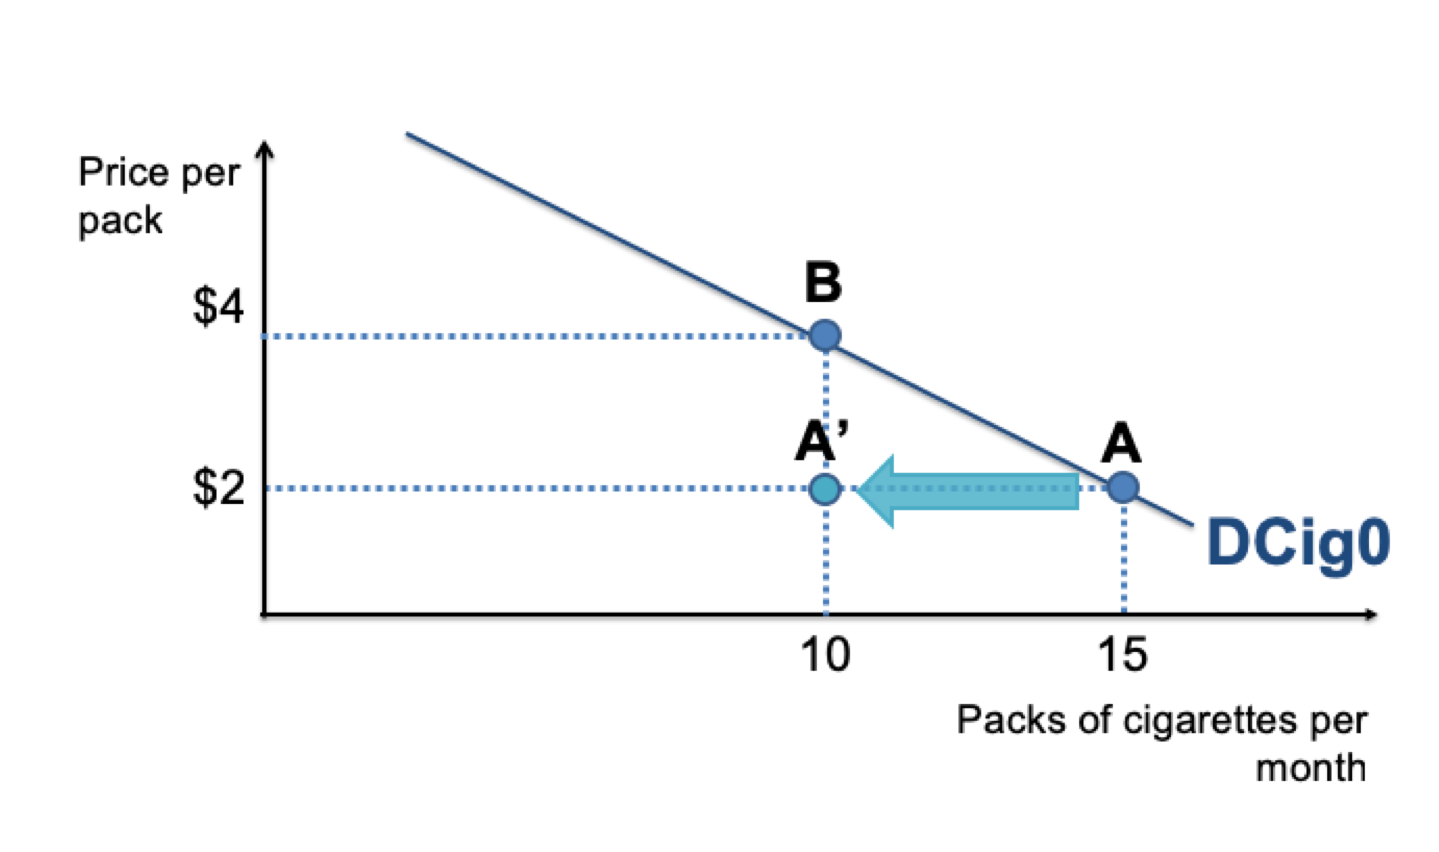
In 1997, a pack of cigarettes cost $2. Suppose that, at that price, Eric was willing to buy 15 packs of cigarettes per week. On Eric’s Demand curve, DCig0, this is point A in the figure below:
As time went by, cigarette prices increased and, in 2007, a pack of cigarettes cost about $4. Prices nearly doubled in a decade! Given the Law of Demand, we expect Eric lowered his consumption of cigarettes to 10 packs per week. That is point B in the figure below:
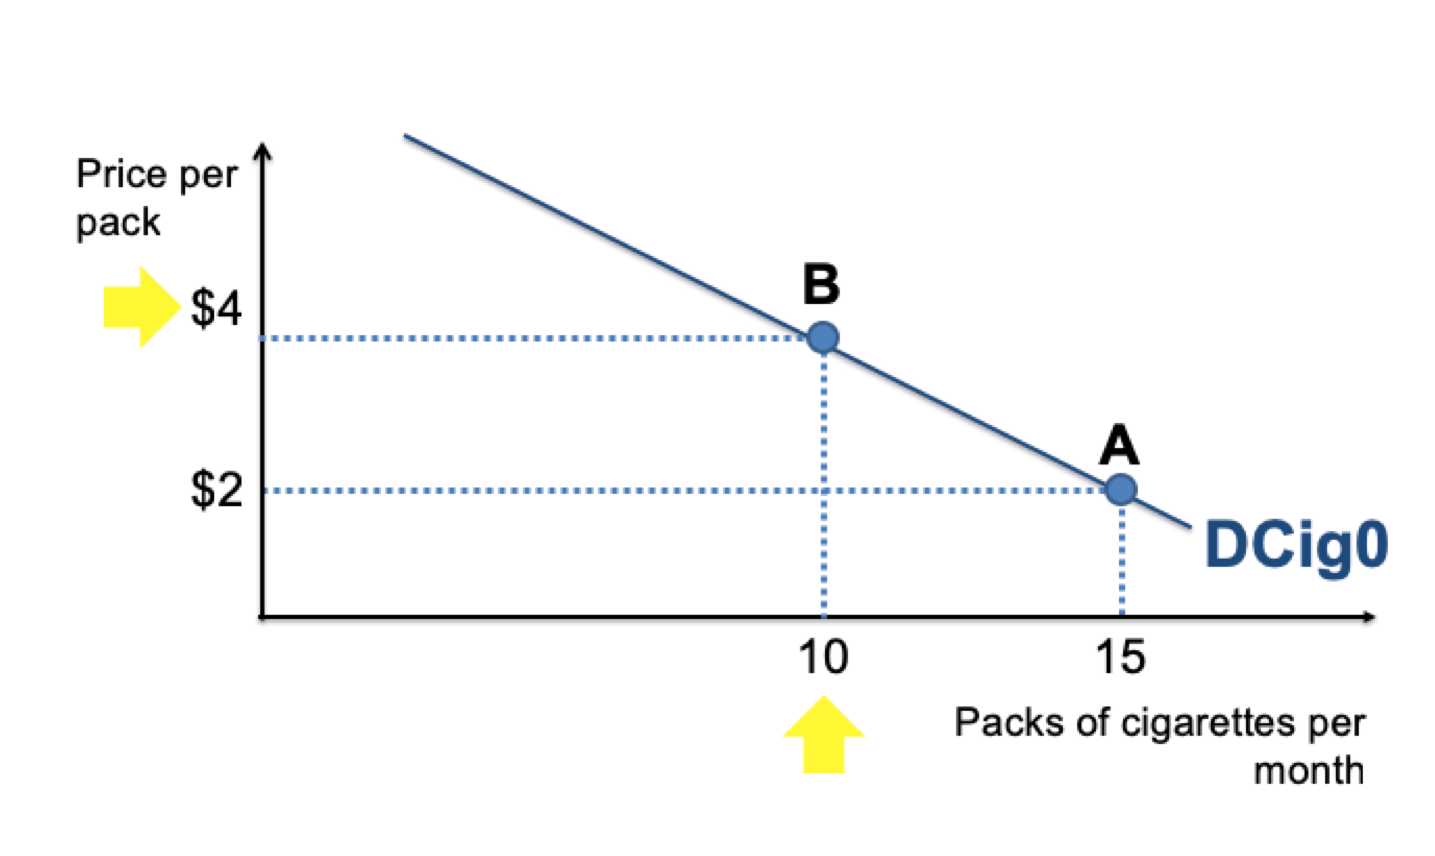
When a pack of cigarettes cost twice as much, Eric’s quantity demanded fell: when a pack of cigarettes cost $2, Eric’s quantity demanded was 15 packs of cigarettes per week (point A), but when it cost $4, Eric’s quantity demanded was 10 packs (point B). In other words, Eric’s quantity demanded went from 15 packs of cigarettes per week to 10 packs, a decrease of 5 packs of cigarettes per week.
Now remember, at this time, Eric did not yet know about the hazardous health effects of smoking, so he kept smoking as he always did and his decision was purely based on price.
Movement Along the Demand Curve
The 5-pack change in quantity demanded was solely driven by a change in the price of cigarettes; economists calls the slide from point A to point B a movement along Eric’s Demand curve:
The change in quantity demanded brought about by the doubling in price, from $2 to $4, is represented by the green arrow above, from point A to point B.
A movement along the Demand curve is caused by a change in the price of the good. Following the Law of Demand, if the price of the good rises, quantity demanded falls and, if the price of the good falls, quantity demanded rises.
Change in Demand
A change in Demand is caused by something other than the price of the good. There are quite a few “Demand shifters”, and these are the reasons that make consumers want more or less of the good, like a change in tastes or a change in income, even the price of a different good, but the point is that the price of the good is not it.
Going back to our example… Eric had a neat sense of humor and, in 1997, even acted in an anti-smoking ad for the American Cancer Society that parodied his former gig:
Clearly, Eric’s preferences for smoking changed. We can probably state that, at any given level of the price for cigarettes, Eric would want to buy fewer packs.
This part of the sentence above is crucial, so I’ll repeat it:
“at any given level of the price of cigarettes, Eric would want to buy fewer packs”
It is crucial because it reveals that, if Eric would buy 15 packs of cigarettes per week when they cost $2 per pack, he would now buy fewer packs than 15, say 10 packs. That is point A’ in the figure below:
Pause for a moment to reflect on the following. The change from point A to point A’ tells a different story than that from point A to point B. The change from point A to point A’ tells us that, at the same level of the price as before, $2, Eric wanted to buy fewer packs, 10 packs instead of 15. The change from point A to B tells us that, when the price of a pack of cigarettes increased to $4, Eric also wanted to buy fewer packs, 10 packs instead of 15. Quite different reasons, aren’t they?
Of course, we expect that when cigarettes cost $4 per pack, Eric would also want to buy fewer packs of cigarettes than 10, say 5 packs. That is point B’ in the figure below:
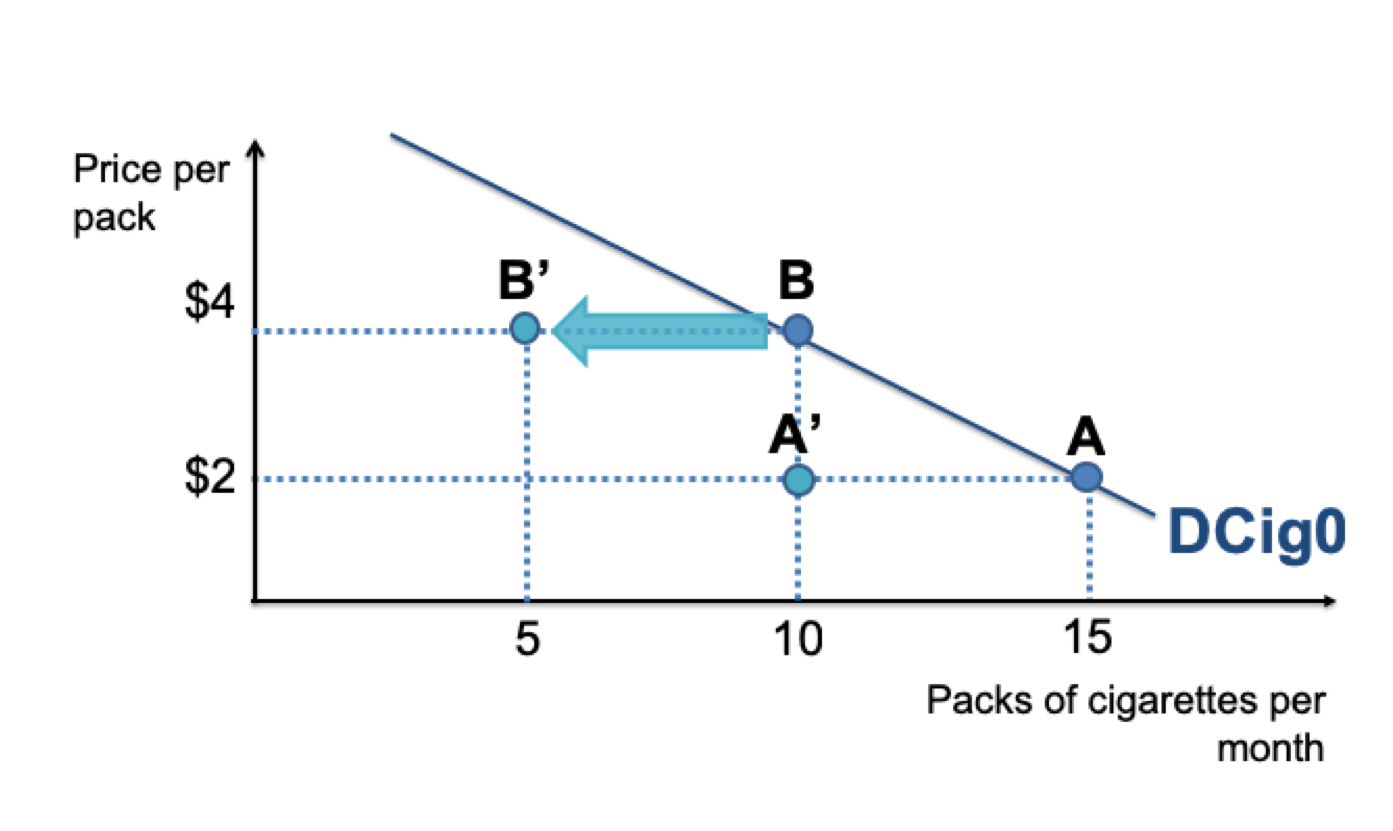
The change from point B to point B’ tells a similar story to that from point A to point A’: regardless of the level of the price, we expect Eric would have wanted to buy fewer packs of cigarettes than before he learned of the bad health effects from smoking.
Shift of the Demand Curve
The change in buying pattern was solely driven by a change in preferences; economists represent this new willingness to buy cigarettes by a shift of the Demand curve to the left, so that Eric’s new Demand curve is DCig1:
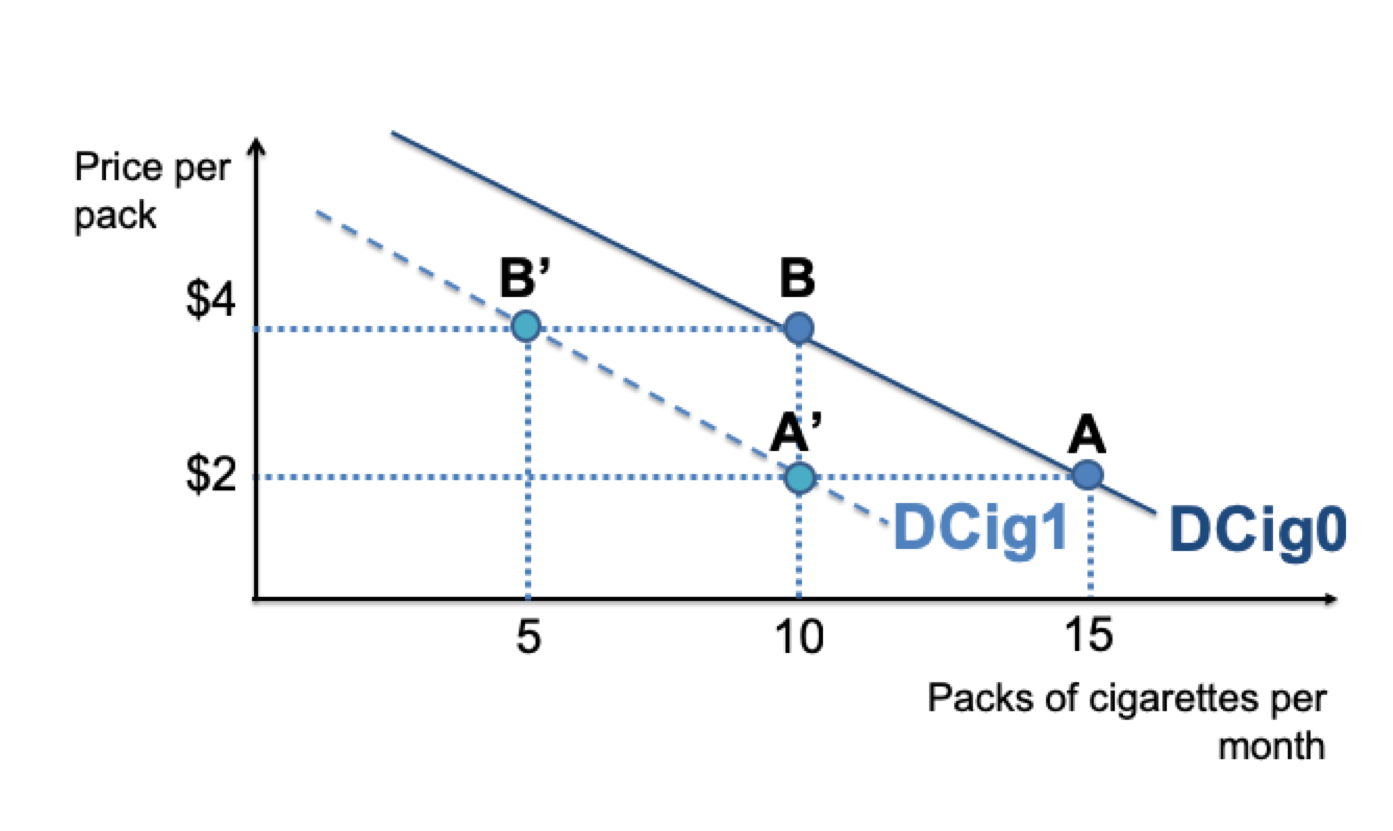
So you see, the two different Demand curves, DCig0 and DCig1 represent different levels of knowledge and, consequently, different preferences about smoking. DCig1, the leftmost Demand curve, represents a lower Demand for packs of cigarettes than DCig0. At any level of the price, after Eric learns that smoking kills, he wants to smoke less.
In short, the difference between a change in quantity demanded and a change in Demand is as follows. A change in quantity demanded is driven by a change in price, and a change in Demand is driven by a change in something other than the price, like a change in preferences or income.
In reality, for many people, smoking decreased due to a combination of these two factors.
Finally, don’t smoke. It’s bad for you and for everyone else. The latter is an externality. I’ll talk about it soon.
